Pradeep Kaushik·Jul 11, 2026·Build Note·11 min read·Updated Aug 22, 2026
In this article 14 sections
In the training-center overview, I proposed a five-stage loop and said I wanted to carry a task through it myself. I built a single-GPU pipeline and tried two: Cartpole, which learns to balance through trial and error, and a Franka arm, which learns cube stacking from demonstrations. I wanted to see whether the same handoffs could carry both, and whether Deploy could pass something useful into the next run.
Both paths completed, but that alone was too weak a test. During the build, a launcher reported success after an inner process crashed, and old artifacts made the dashboard look as if fresh work had finished. That failure changed what I required at every stage boundary. The results below describe the recorded runs after those checks; all deployment measurements remained off-robot.
How a full run flows
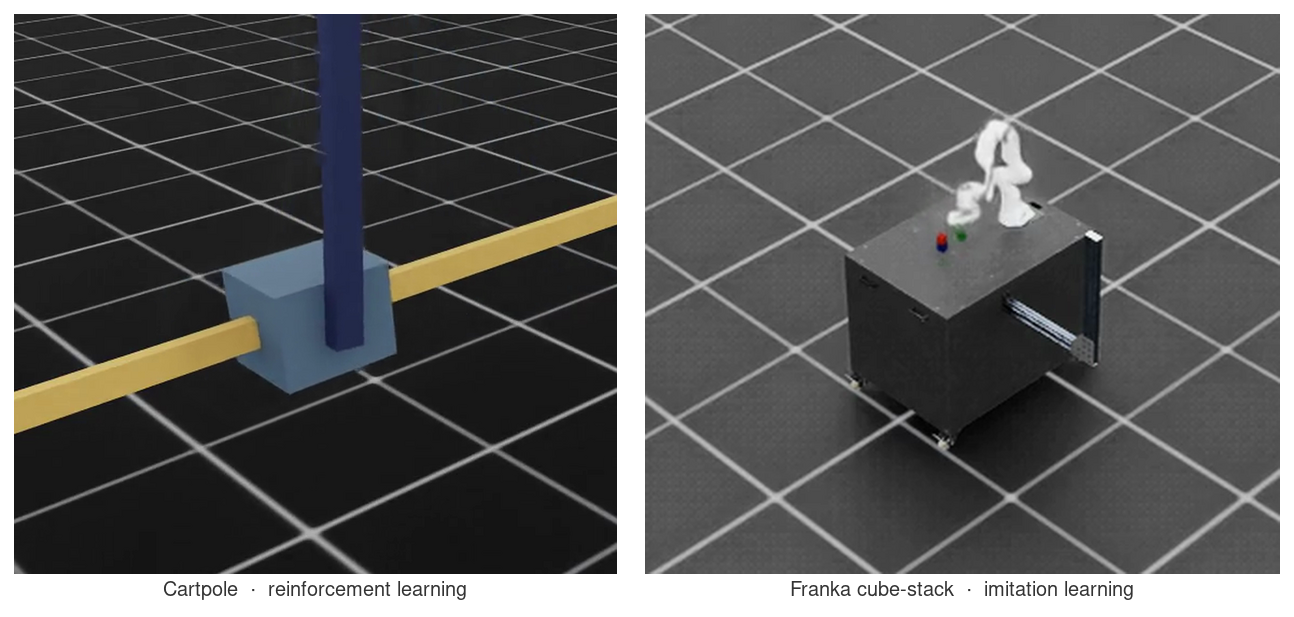
Clicking Run kicks off the same five stages in the same order for either task. What differs is what each stage does inside — but first, the two tasks themselves:
The two tasks in the simulator. Left — Cartpole: a cart slides along a rail to keep a pole upright, learned by reinforcement (trial and error against a reward). Right — Franka cube-stack: a robot arm stacks colored cubes on a table, learned by imitation (copying human demonstrations).
For Cartpole (reinforcement learning), Capture is skipped (no demonstrations, only a reward) and reported as skipped-rl. Simulate writes a small config report; the environment itself is instantiated by Train, which runs PPO across 4,096 parallel environments for 150 iterations, until the reward curve plateaus. Validate reloads the trained policy, rolls it out over a set of episodes, and records a rollout video. Deploy exports the policy to ONNX, benchmarks p50/p99 inference latency, and writes next_run. The whole sequence takes about three minutes. Cartpole is the smoke test here — the fastest task that runs all five stages for real — so its low absolute reward doesn’t matter; a working loop does.
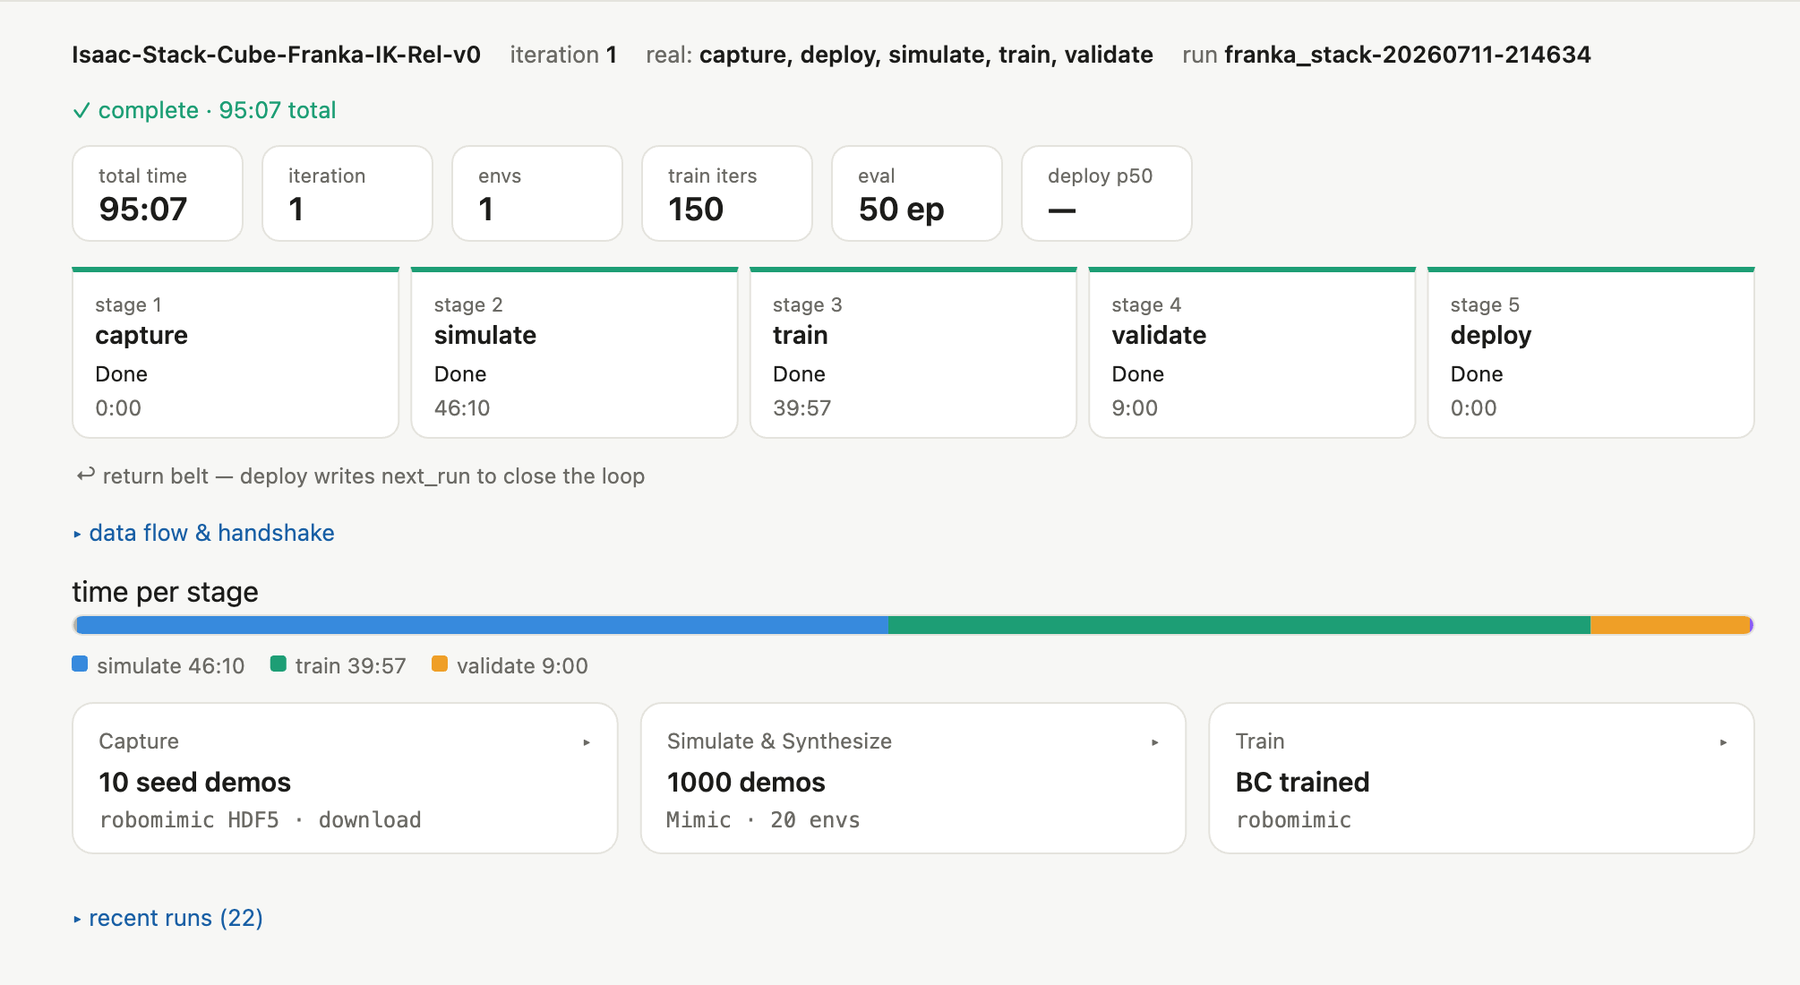
For Franka cube-stack (imitation learning; a 7-DOF arm stacking cubes), Capture is real: it loads ten seed demonstrations, NVIDIA’s published human-teleop set. Simulate is now the heavy stage — Isaac Lab Mimic annotates those demos and generates 1,000 variations across randomized cube positions. Train fits a behavior-cloning policy (robomimic bc_rnn_low_dim, ~2,000 epochs, no tuning) to that dataset offline, with no simulator running. Validate rolls the policy out over 50 episodes and reports a success rate; Deploy records it as inference-only (ONNX export isn’t wired for behavior cloning yet) and writes next_run. End to end, about 95 minutes, most of it in Mimic and training.
Part 2 explains why I chose imitation for cube stacking, and why one path runs the simulator during training while the other doesn’t. The build here shows that one runner and one contract carry both without changing shape.
The two runs
I chose two tasks to exercise different learning methods through the same loop. These are the measured per-stage results from the two recorded runs whose media is in the repo:
Scroll sideways for more columns.
Stage
Cartpole (RL)
Franka cube-stack (imitation)
Capture
skipped-rl (no demos)
10 seed demos (download)
Simulate & Synthesize
config only, ~0:00
Mimic 10 → 1,000 demos, 46:10
Train
PPO, reward 4.94, 2:27
behavior cloning, 39:57
Validate
32 episodes, 0:40
50 episodes, 72% success, 9:00
Deploy
ONNX, p50 0.009 ms / p99 0.027 ms
inference-only (ONNX not wired for BC)
Total
~3 min
95 min
The same contract after the longer imitation run. The dashboard holds the whole 95-minute path in one view: ten seed demonstrations, 1,000 generated variations, behavior-cloning training, and the 50-episode validation. The time bar makes the main difference from Cartpole immediate—the expensive work moved upstream into synthesis.
Everything here ran on the single 48 GB card without batching or memory tuning — the 4,096-environment RL job and the 1,000-demo Mimic generation each fit as-is.
Both policies are recorded. The Cartpole clip is a three-second smoke-test rollout. The Franka recording below contains ten evaluation rollouts produced by the separate offscreen recorder. The auto-generated run report (PDF) carries the stage evidence from the same run.
Ten Franka cube-stacking rollouts from the offscreen recorder. Eight succeeded in this clip. The reported 72% success rate came from the full 50-episode evaluation, not from the ten shown here.
At 50 generated demos the Franka policy succeeded about 2% of the time; at 1,000 it reached 72%, from the same ten seed demonstrations. Those were two runs at different dataset sizes, not a repeated fixed-seed experiment, so I cannot turn the gap into a clean scaling law. It does suggest that generated variety was the main lever in this setup. Why the two tasks take such different shapes inside the same loop — Capture present or skipped, the sim running during training or only to generate data — is the subject of Part 2.
A successful exit hid a failed run
The bug worth recording: the Isaac Lab launcher script returns exit code 0 even when the Python process inside it crashes. A stage would shell out, the inner training would die, the launcher would report success, and the stage would reuse artifacts from the previous run — reporting a completed 1,000-demo generation in about twenty seconds with the last run’s numbers. It worked the first time and silently reused stale data every time after. The fix was to stop trusting exit codes: every real stage records a timestamp before starting and rejects any output older than that, marking itself failed if outputs are stale or missing. Robot pipelines are full of tools built to be run once by hand, so re-runnability also meant every stage deletes its own prior outputs first — half of them refuse to overwrite, and the other half block on an interactive “are you sure?” prompt that hangs with no terminal attached.
What I built
The system hangs on one design decision: the filesystem is the contract. Each of the five stages is an independent script that reads its inputs and writes exactly one JSON report into a shared run folder. No stage imports another.
The contract and the filesystem are different layers. The contract — stages coordinate only through declared artifacts, never shared code or memory — is the durable design choice, and I’d keep it in a real system: it’s what let me build the dashboard mock-first with no GPU, swap a stage’s learning method without touching the others, and treat scaling to OSMO (NVIDIA’s cluster orchestrator) as an executor swap rather than a rewrite. The filesystem is just the medium, and the deliberate simplification: on one box, JSON files in a run folder are enough, where a production system would put the same artifacts in object storage or a dataset service. The medium can change while components still plug in and the loop extends progressively, which is what a horizontal capability needs.
A lightweight runner — effectively a single-node orchestrator — reads a loop.yaml file describing the stages as a dependency graph, runs them in order, and stamps a manifest after each. It plays the orchestrator role on one box; in a production design it’s the piece you’d swap for a full orchestrator like OSMO. The browser dashboard holds no logic of its own; it reads those JSON files and renders the run, mock or real.
That same decision is what makes the return belt concrete. The Deploy stage writes a next_run hint into its report, and the runner reads it to seed the next iteration. The flywheel the article kept insisting on is, in practice, a file one stage writes and the next run reads.
Architecture and data flow
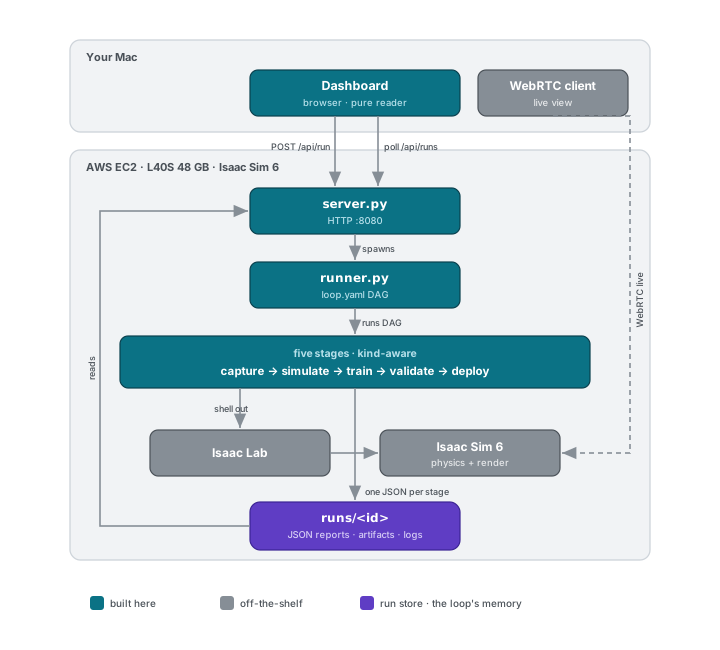
The architecture, grouped by where things run and colored by who owns them: teal is what I built (the dashboard, server.py, runner.py, and the five stages), grey is off-the-shelf (Isaac Lab, Isaac Sim), and purple is the run store — the loop's memory. Every stage writes exactly one JSON report into runs/<id>/, and the server only ever reads it. Deploy's next_run seeds the next iteration and closes the loop.
The control path is one direction and the data path is the other. The dashboard sends a single POST /api/run (task, mode, stage flags) and then polls /api/runs/<id> for state; it renders whatever JSON it finds and nothing more. On the host, server.py spawns runner.py, which topologically orders the stages from loop.yaml, runs each as a subprocess that shells out to isaaclab.sh, and writes per-stage timings and reports into runs/<id>/. That folder is the loop’s entire memory: the manifest (loop.json), the five stage reports, and the artifacts (datasets, checkpoints, exported policies) referenced by hash. Running the server inside the env_isaaclab conda environment, so its spawned subprocess inherits the simulator’s heavy Python env, was the specific thing that let a browser button launch a real GPU run.
The same structure in text, for any view that can’t load the diagram:
CLIENT · your Mac Dashboard SPA (pure reader) │ POST /api/run · poll /api/runs → JSON ▼HOST · AWS L40S · Isaac Sim 6 server.py :8080 ─spawns─▶ runner.py (loop.yaml DAG) │ runs the 5 stages; each shells to isaaclab.sh ▼ capture ▶ simulate ▶ train ▶ validate ▶ deploy │ every stage writes one JSON into runs/<id>/ ▼ runs/<id>/ · loop.json + 01–05_*.json + artifacts └ deploy writes next_run ▶ seeds the next run
The stage contract
Every stage emits one JSON report with a shared envelope: stage, status, mode, metrics, artifacts, and — on Deploy — a next block that carries the return belt. The manifest tracks the task, the current iteration, and a stage-status map. That contract is the only coupling between the stages and the dashboard, which is why either can be developed in isolation. The Deploy report from a Cartpole run looked like this, trimmed:
The next block is the return belt in its entirety: the runner reads it and applies params to the following iteration.
The dashboard
The dashboard made the loop visible before I had the full stack or any real numbers. It is a single page served from the GPU host and opened in a browser. You pick a task and settings at the top, hit Run, and watch the five-stage ring fill in. A metrics row, a time-per-stage bar, and expandable cards keep the timings, stage details and artifact downloads in the same view. You can watch each stage finish instead of trusting a log.
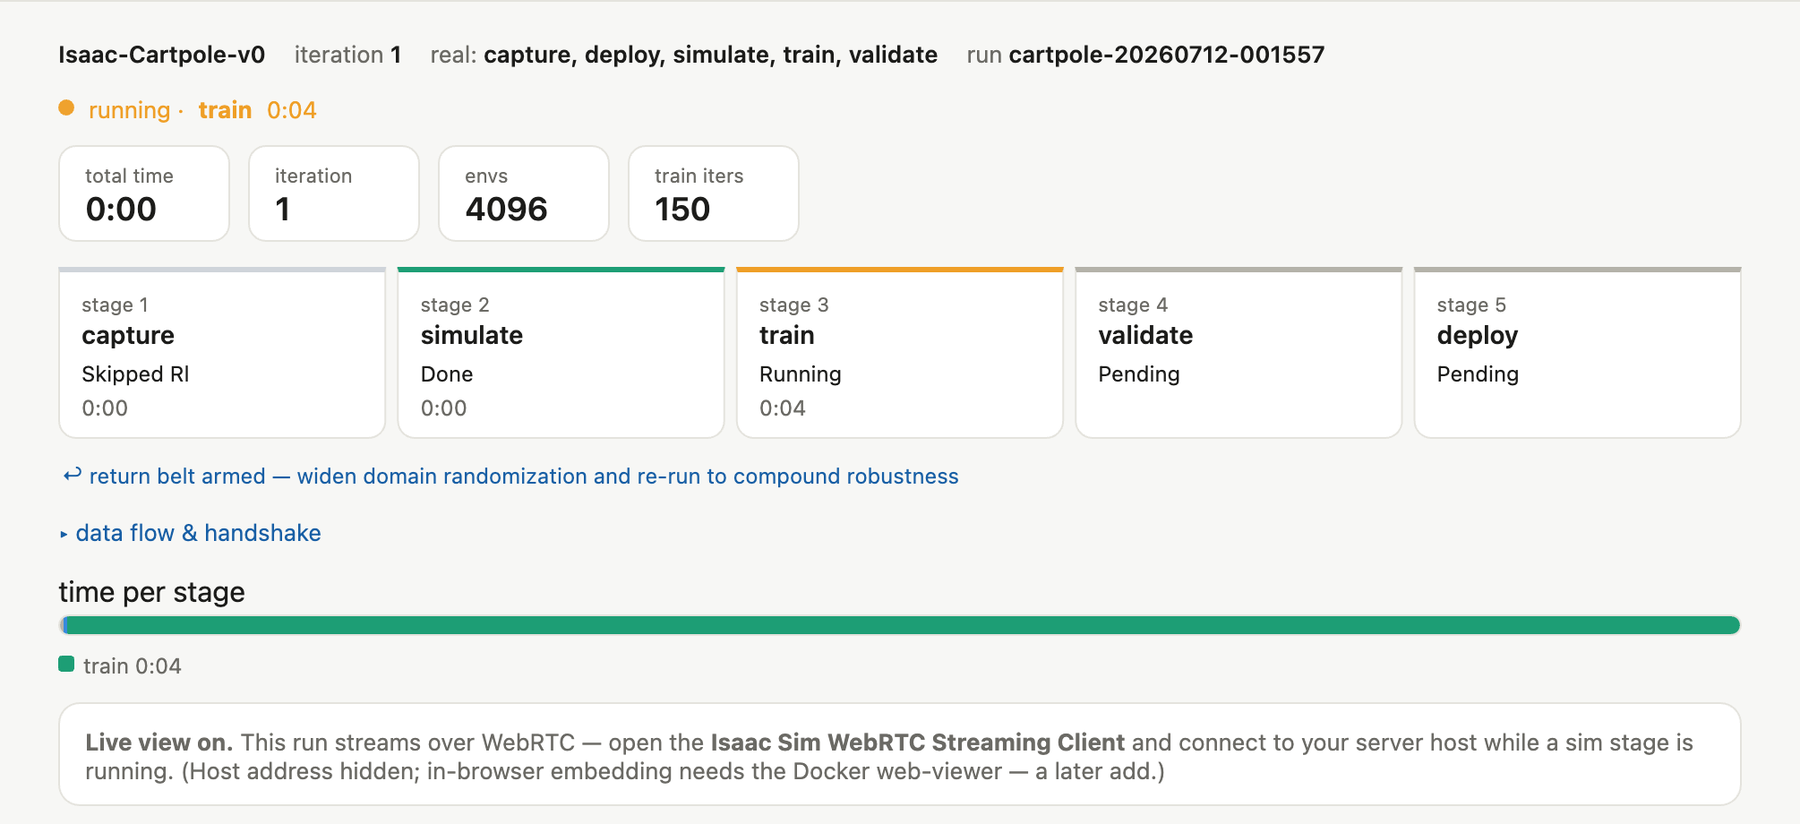
The recording below starts just before I launch a real Cartpole run. Capture is skipped for reinforcement learning and Simulate is configuration-only, so those cards finish almost immediately. Train, Validate, and Deploy make the progression visible. I also open the optional Isaac Sim live view during training.
A real Cartpole run progressing through the same five-stage contract used by Franka. The stage cards, timers, reward, evaluation count, deployment latency, and generated artifacts update as the loop advances.The loop while it is moving. Four seconds into Cartpole training, the stage contract is visible without reading a terminal: Capture is honestly skipped, Simulate has handed off, Train owns the clock, and the remaining stages are waiting. This is the view I used to tell progress from a stalled process.
Mock mode let me build the dashboard and exercise the report contract without a GPU. Real runs used the same view, with settings, per-stage timers, a recent-run table and automatic report/artifact downloads. The optional live stream helped inspect a rollout; the saved stage evidence remained the record to compare across runs.
Environment
Everything ran on a single cloud GPU instance, driven from a browser on a Mac. No cluster, no second machine.
Scroll sideways for more columns.
Instance
AWS EC2 g6e.2xlarge (8 vCPU, 64 GB RAM)
GPU
1× NVIDIA L40S, 48 GB
OS / driver
Ubuntu 22.04, NVIDIA driver 580.126.16
Python
3.12 (conda env env_isaaclab)
Client
Browser on macOS, over an SSH tunnel to :8080
Two version constraints mattered in this tested setup: Python 3.12 and the Isaac Lab branch paired with Isaac Sim 6. The setup failures below explain why the pins are part of the reproduction record.
The stack
The whole thing runs on the open/free stack; the only cost is GPU hours. Components by role:
Scroll sideways for more columns.
Role
Component
Notes
Simulator
Isaac Sim 6.0.1.0
native WebRTC streaming
Task framework
Isaac Lab release/3.0.0-beta2
main pairs with Isaac Sim 5.1, not 6
Deep learning
PyTorch 2.10.0 + cu128
installed by the Isaac Lab beta
RL training
rsl_rl (PPO)
native ONNX export — the reason I chose it
Imitation data-gen
Isaac Lab Mimic
annotate + generate demonstrations
Imitation training
robomimic
behavior cloning (bc_rnn_low_dim)
Deploy benchmark
onnxruntime
measures p50 / p99 inference latency
Orchestrator
custom single-node runner + PyYAML
interprets the loop.yaml DAG
Server / dashboard
Python stdlib HTTP + vanilla HTML/JS
no framework, no build step
I built the single-node runner deliberately instead of standing up NVIDIA’s OSMO, which assumes a Kubernetes cluster, object storage, and a registry. But I built it to mirror OSMO’s model — a declarative DAG, content-addressable artifacts stored by hash, and stages that declare the compute they need — so that moving to OSMO at scale would be an executor swap rather than a rewrite. That portability is a design intention I haven’t yet tested against a real cluster.
One caveat on the whole stack: these are the versions that worked together when I tested this, in July 2026. Isaac Sim 6 is a recent release, and I deliberately ran on the newest line to put it through its paces — so expect the exact pairing (Isaac Sim, the Isaac Lab branch, the PyTorch build) to move over time.
What I used at each stage — and what I skipped
The version table records the executed stack. This table separates that path from the larger system I had in mind; an omitted component is not a tested failure of that component.
Scroll sideways for more columns.
Stage
What ran
Deliberately outside this test
Capture
Downloaded seed demonstrations in robomimic HDF5; skipped for Cartpole
Live teleoperation and a new capture rig
Simulate and synthesize
Isaac Sim, Isaac Lab and Mimic for the imitation path
Cosmos generation and Replicator perception data
Train
rsl_rl PPO and robomimic behavior cloning
VLA post-training and a stronger-method comparison
Validate
Rollouts in the task environment
External benchmark batteries and physical-robot safety validation
Deploy and orchestration
ONNX latency for Cartpole, inference-only Franka, local runner
On-robot execution, fleet infrastructure and an OSMO migration
Cosmos is the clearest deliberate deferral. I left it out to start because running it in parallel with everything else on a single GPU wasn’t where I wanted to begin. I already have a Cosmos synthetic-data pipeline working on its own, and the plan is to drop it into the Simulate stage as a pluggable source of generated data — exactly the kind of extension the contract is meant to allow. It’s on the backlog for now.
Where I actually got stuck
The stage-output checks were only part of getting repeatable runs. The simulator environment and recording path also needed explicit choices.
The stack needed a specific, non-obvious pairing. Isaac Sim 6 wants Python 3.12; my packages first installed against 3.13 and silently did nothing useful. Isaac Lab’s main branch pairs with Isaac Sim 5.1 and an older PyTorch, so getting Isaac Sim 6 meant pinning Isaac Lab to a specific beta release branch. I couldn’t find it documented as a single instruction anywhere. I also started on rl_games and moved the entire training and validation path to rsl_rl for one reason: rsl_rl exports an ONNX policy natively, which is what let Deploy benchmark real latency instead of faking it.
One smaller gotcha shaped the media: on the imitation path, robomimic can’t write a rollout video; its player only streams to a live client. The clean footage of the arm stacking cubes comes from a separate offscreen recorder I wrote — it loads the checkpoint, runs the rollouts headless with cameras enabled, and captures frames straight to an MP4.
The scorecard
The build tested the bets in my original overview. This scorecard preserves what each one amounted to in these two tasks:
Scroll sideways for more columns.
Article claim
How the build treated it
Where it landed
It’s one loop, not ten
One run flowed through all five stages; Deploy wrote a file for the next run
◑ The path completed once; compounding across runs is untested
Own the middle, rent the edges
The same middle pipeline and contract carried both tasks; Capture and Deploy changed by method
◑ Reuse worked here; whether it is the durable technical or business moat remains open
Capture is the hard part
RL skipped demonstrations; the imitation task depended on ten seed demonstrations
◑ Shown for this imitation task, not as a general rule
Synthetic data unlocks behavior
Mimic turned 10 demos into 1,000; success moved from ~2% to 72% in two differently sized runs
◑ Encouraging and conditional; it needs controlled repeats
Adaptation over invention
Behavior cloning got 72% out of the box; foundation-model post-training is untested
→ Deferred to the next build
Validate is the unsolved link
Sim-eval works; safety_certified is false on every run
⚠ Left open on purpose
Limitations
Two limits are structural. Deploy reports on_robot: false on every run: this is deploy-as-inference, where the policy is exported, loaded, and benchmarked, but never touches physical hardware. And a 72% success rate in simulation measures capability, not safety — there is no trusted way to turn one into the other, so safety_certified is false on every run. That second one isn’t a gap in the build; it’s an open problem for the field, and the loop’s job here is to mark the seam precisely instead of covering it.
What’s next in the build
The next test I would prioritize is the return path: run several iterations, preserve what changed in the data and check whether the next policy improves. The current hint file proves a mechanical handoff, not a learning flywheel. Stronger learning methods, another synthetic-data source and a cluster executor remain separate comparisons; none is established by these two runs.
Code, the full build log with every version pin and fix, the stage reports, and reproduce-from-scratch steps are in the repo: github.com/pr9868/robot-training-loop-demo. Part 2 covers what the runs mean, and where I’m still not sure.
Disclaimer: The views and opinions expressed in this account are those of my own and do not represent those of my employer, NVIDIA.